[Link für Deutsche Übersetzung]
FactGrid is a graph database. If you run searches in such a database you should rather not think of a resource filled with interrelated tables (of people, places, organizations, documents…) – but of something more spatial, more geometric, more graphic.
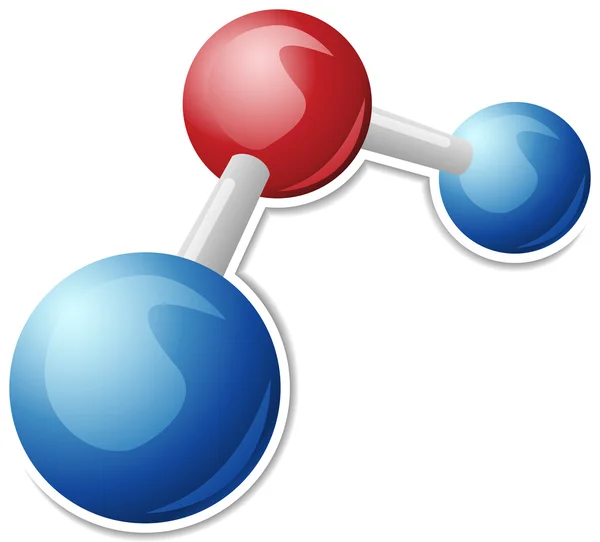
Think of your own knowledge. You will not be able to give a table of all the names that have a meaning in your knowledge, or of all the places related to these names. Our knowledge is more like a web of interrelated objects. Nicolaus Copernicus? He is the man who wrote De revolutionibus. What else do you know? Maybe that he was born in Thorn, Polish Toruń, and that he studied at the Universities of Padua and Bolognia. I at least do not immediately know much more about the author who brought about the “Copernican Revolution”. That, of course, is an object that rings many more bells, with all the connections to other items of knowledge it has in my knowledge. I can add that these two universities were good places to study those subjects that were to become the natural sciences – but that again is knowledge on these objects, not on Copernicus, knowldge that got stuck in my knowledge as it added some more colour to my knowledge about Copernicus, the person. Think of interrelated objects hanging together in the wider mesh of your knowledge – of objects that link to each other like atoms in a molecule.
…an object with links to two other objects? That could be someone linked to her two parents. The graph would not look different if that was another person with his two daughters, or Copernicus with links to the two universities mentioned. Well, Copernicus studied at four universities, to be precise – but that is not the problem.
The problem is that the molecular model does not carry particularly well as it puts all the differences into the atoms, hence the various colours in images and the different connectivities of atoms in the typical three dimensional tool kits. In a database like FactGrid all the objects are structurally completely identical. They all are just “Items”: meaningless points, “nodes”, under Q-numbers counted up from 1 to infinity. The various and very specific Properties between the objects make all the differences in a graph database: “Fathers” are in FactGrid Items that have P141 “father” properties referring to them; mothers have P142 Properties linking from other items towards them.
In a triple-based database (which breaks down all knowledge into three-part statements) we will need no more than two sorts of components: You can take spheres for the objects of our knowledge, the “Items”, and arrows for the links that run between them – arrows as we have to express directions in the various statements.
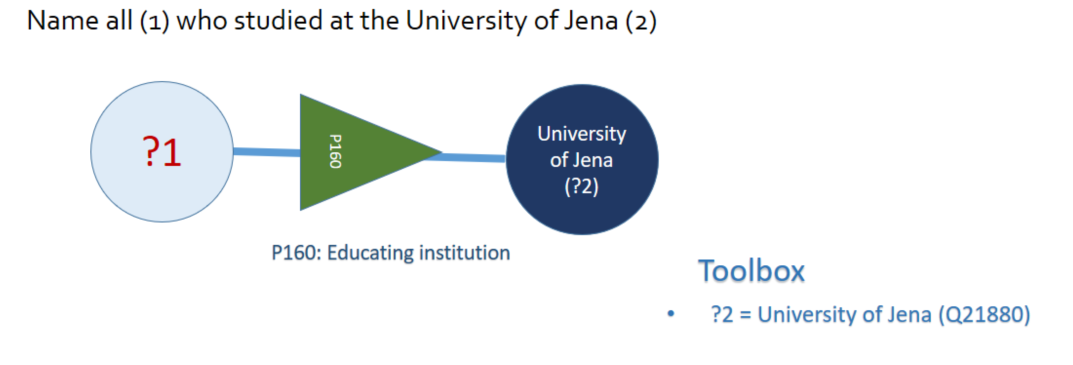
Those who studied at the University of Jena have P160 “educating institution” statements leading from their Items to the University of Jena Item Q21880. This is the SPARQL script (see this link to see what it does):
SELECT ?Item ?ItemLabel WHERE {
SERVICE wikibase:label { bd:serviceParam wikibase:language “[AUTO_LANGUAGE],en”. }
?Item wdt:P160 wd:Q21880.}
SPARQL is a wonderfully versatile language to send searches through graph databases but it is impossible to script even this most simple query without handbook knowledge. What is worse: You will need additional knowledge of our database to know that Jena’s University has this the Q-number Q21880 and that students must have P160 statements on them that will link to this University with the Q21880 indetifier.
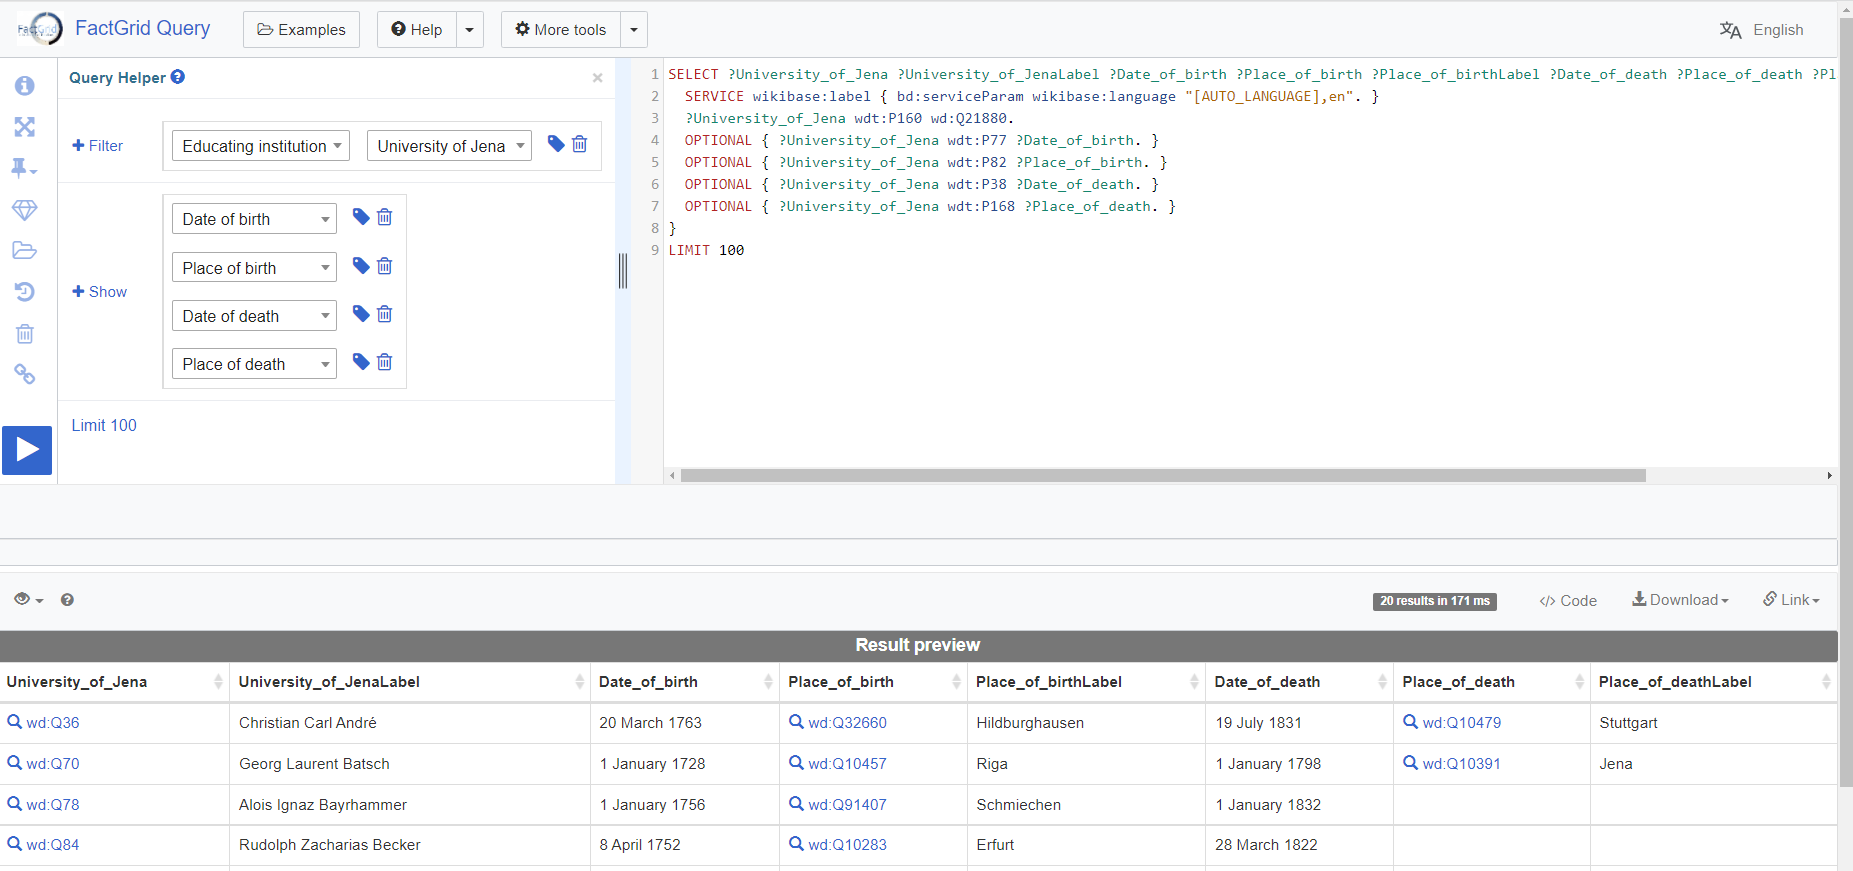
The Wikimedia Query Helper is the coolest gadget as soon as you understand what a “Filter” can do for you in your query. Once you realise that this is the input field that will need the university in your specific query you can start to type “Univ…” and the autocomplete will lead you to the Q-number you are looking for. Select the Item you are interested in and the tool will already propose the “who studied here?” Property P160 as this is the most used Property leading to Q21880. It is fair to assume you are looking for people who studied at this university.
You can now ask for more information about these students as far as they are found on their Items, such as the dates of birth and death with both places in separate columns, and the names of their fathers and mothers. This is a search that uses the Query Helper:
And this is where the present Query Helper will leave you. The coordinate locations of the places of birth are on their respective Items (not on the student Items which you have been exploring so far). You need these coordinates to get a map representation, but the Query Helper does not show you how to extend your search into the related objects, nor does it show you how to bring qualifiers into your list (like the matriculation begin and end dates stated with many of the P160 links). It is also difficult to switch to reverse questions. You already know the person and now you want to know more about him, while you are still asked to use a filter…
One should have a graphic – a visual – query editor on a graph database
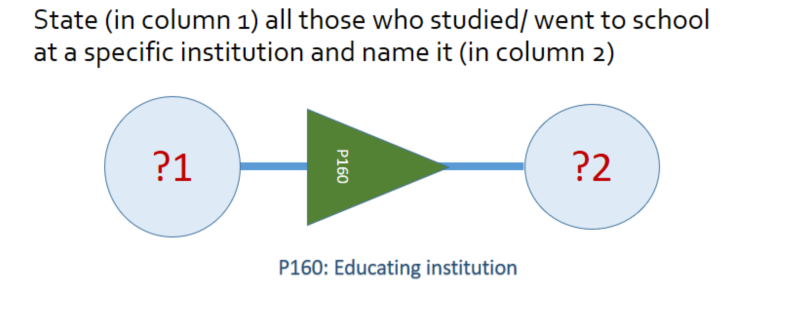
This is what the open question looks like: Who studied where? I put numbers in the circles to designate table columns.
If you are only interested in Jena University students, you should be able to specify that right on the university’s Item. Click into its sphere and type “University of Jena” into the circle:
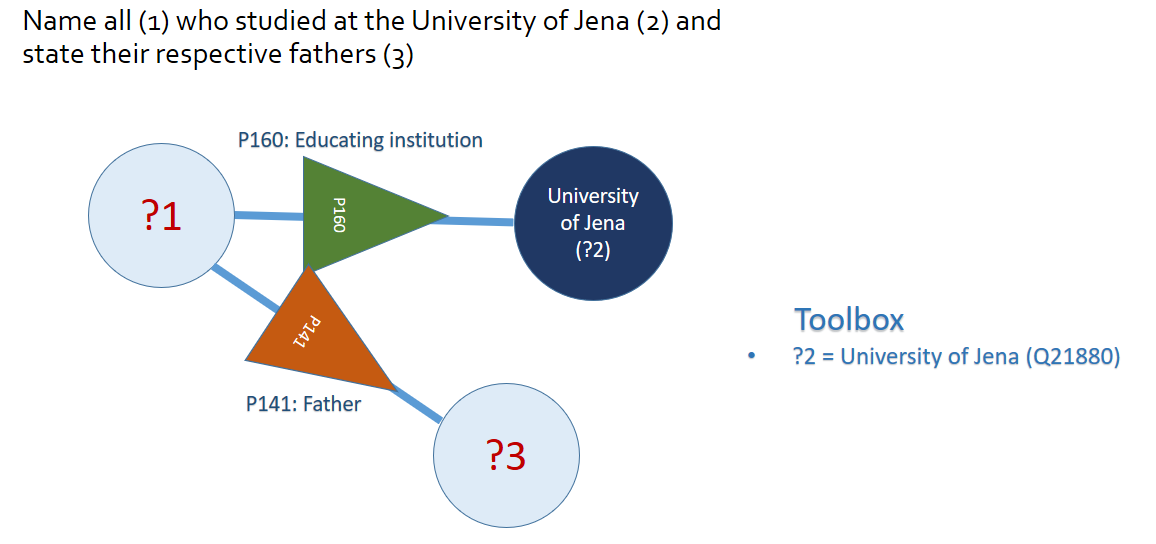
You can now expand the query as you wish with clicks into the objects or the arrows, for example by asking for the “fathers” (P141) of these sutudents, who will appear in column 3 (this script):
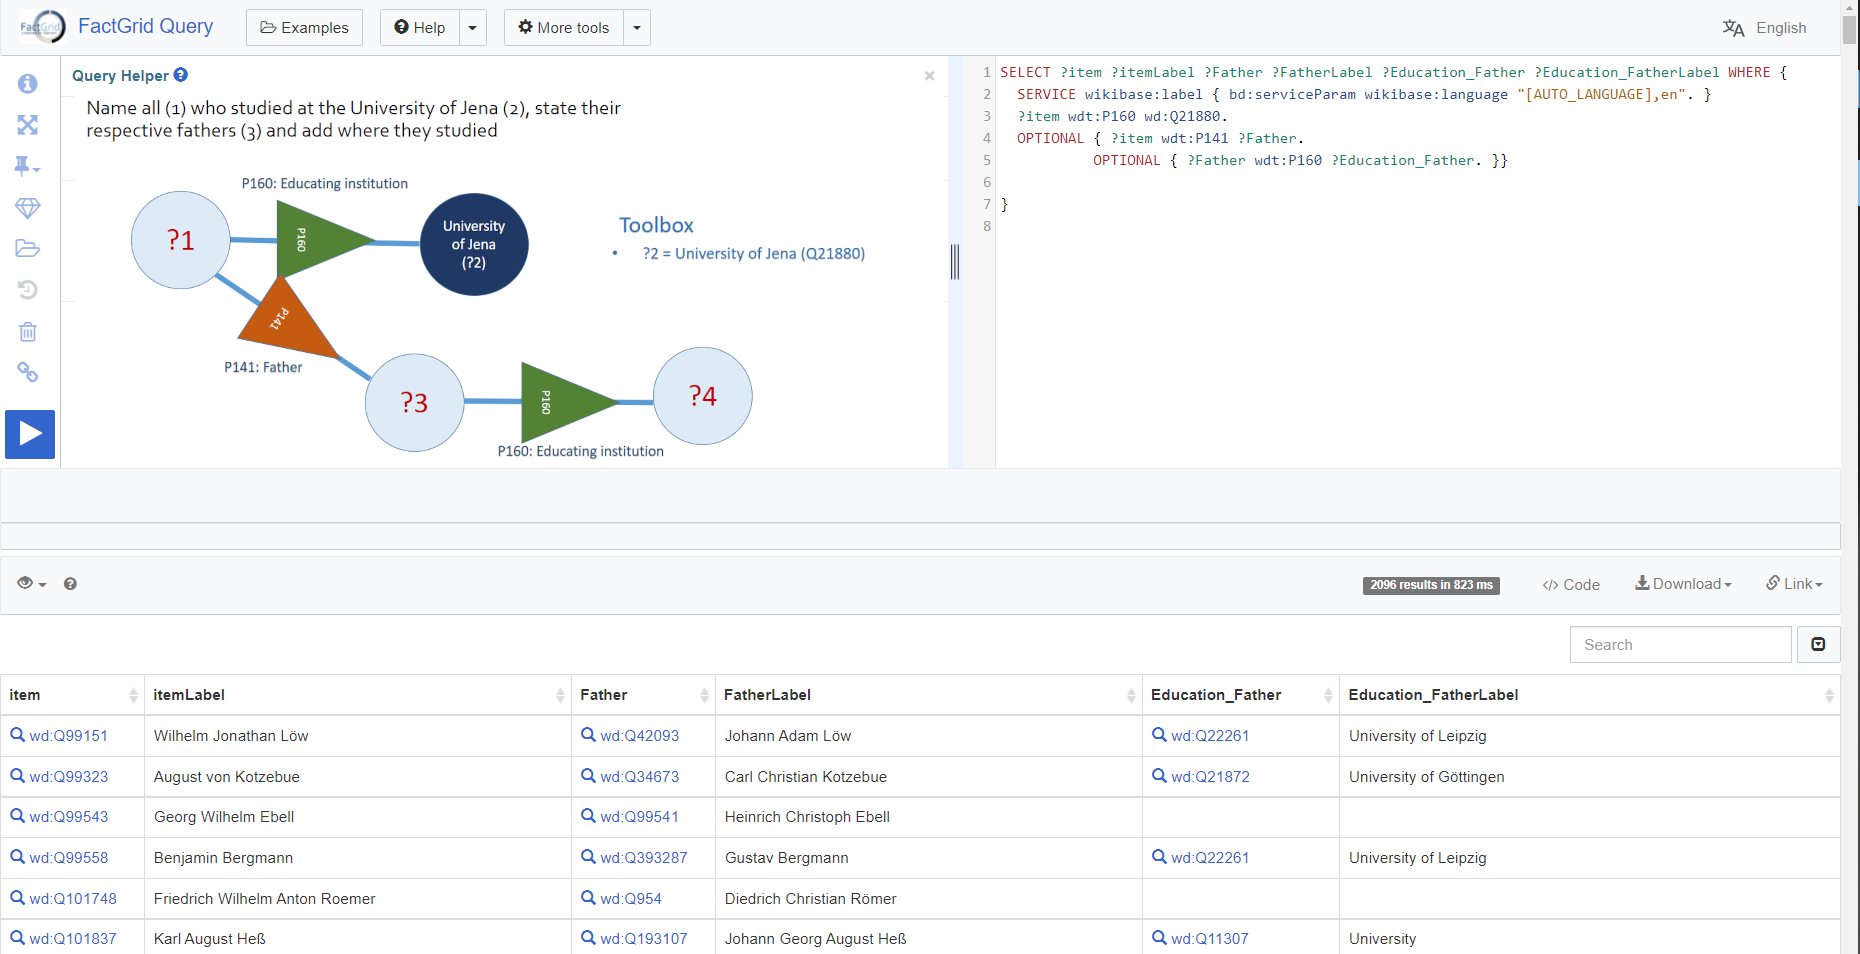
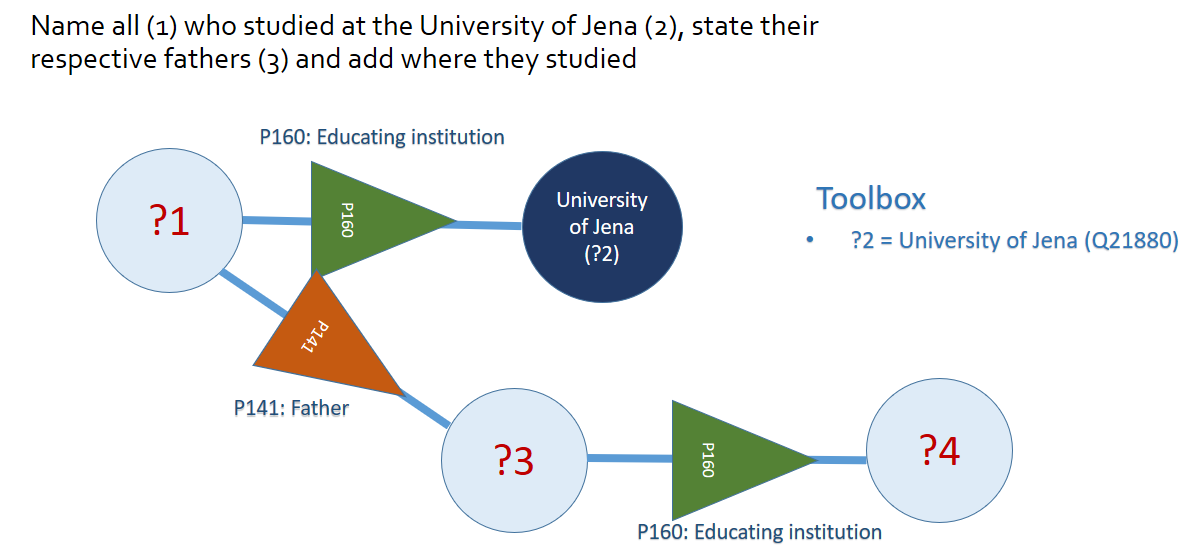
And it will now be easy to get more information from the fathers – like which schools and universities did the fathers attend, again P160 (script link)?
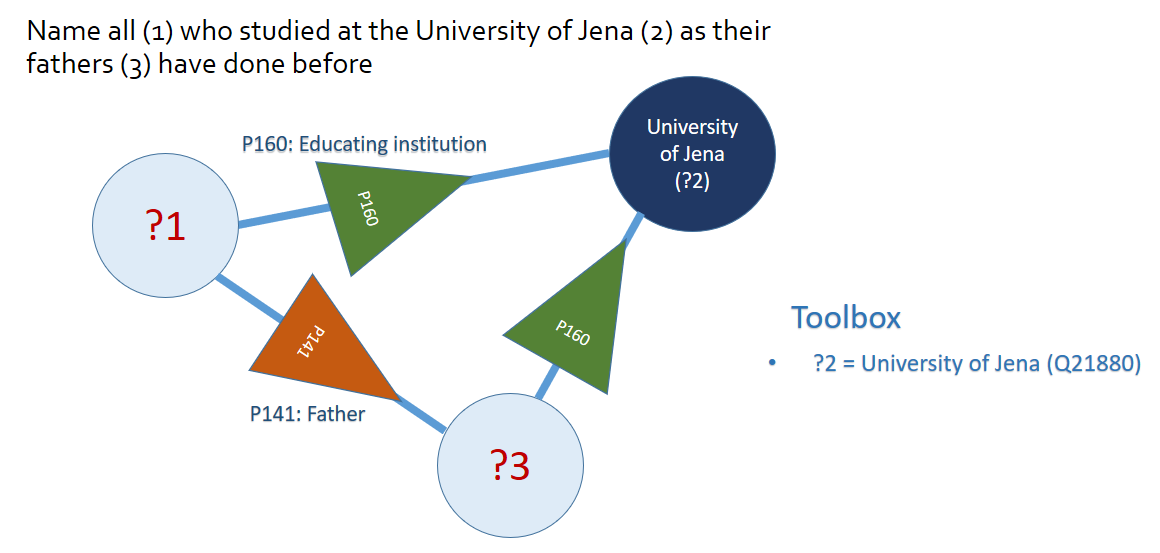
One could also formulate the short-circuit question to get all the students who studied in Jena just as their fathers had done before:
I gave the arrows in different colours because they are the components that make all the difference in objects. You want to spot identical questions and similar objects in your searches.
Optional / Mandatory
Perhaps a simple exclamation mark on the Property arrows would be enough to mark statements that shall work as filters.
Qualifiers
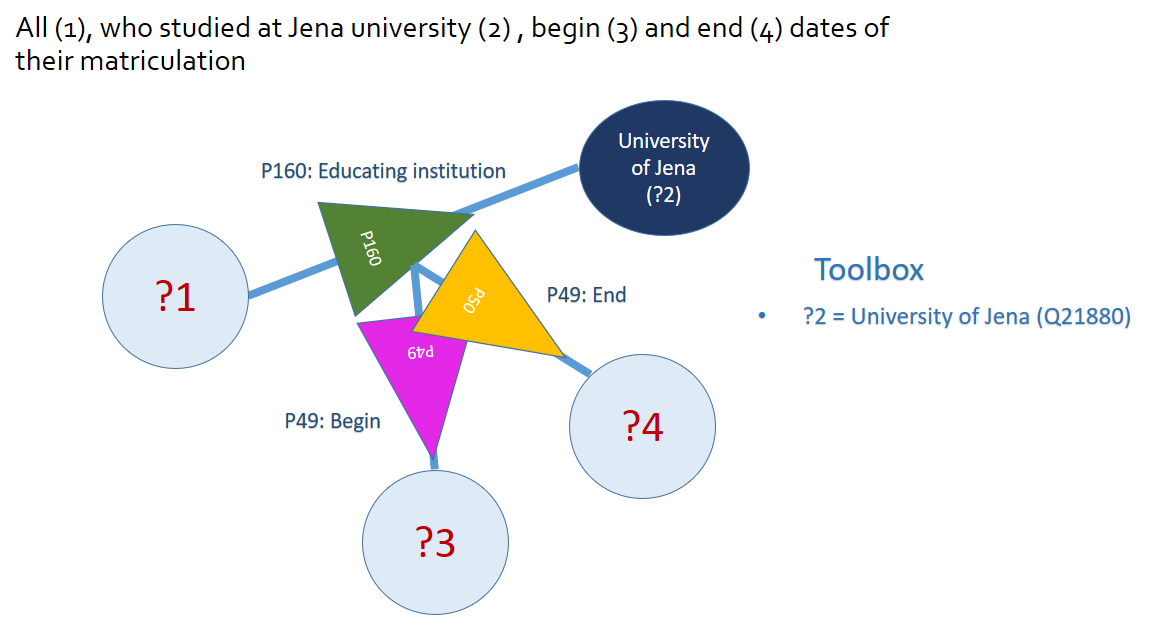
Qualifying statements are a bright Wikibase invention. Any primary triple can become the object of specific, qualifying statements. That is basically the relative clause we need in such a language (for instance if we have a person who studied at four universities and we want to say from when to when on each case). If we want to keep the graphic repertoire lean, we could simply link the qualifying statements to the Properties – for example, to get two separate columns for the begin and end dates of a specific university matriculation:
Opening the toolbox
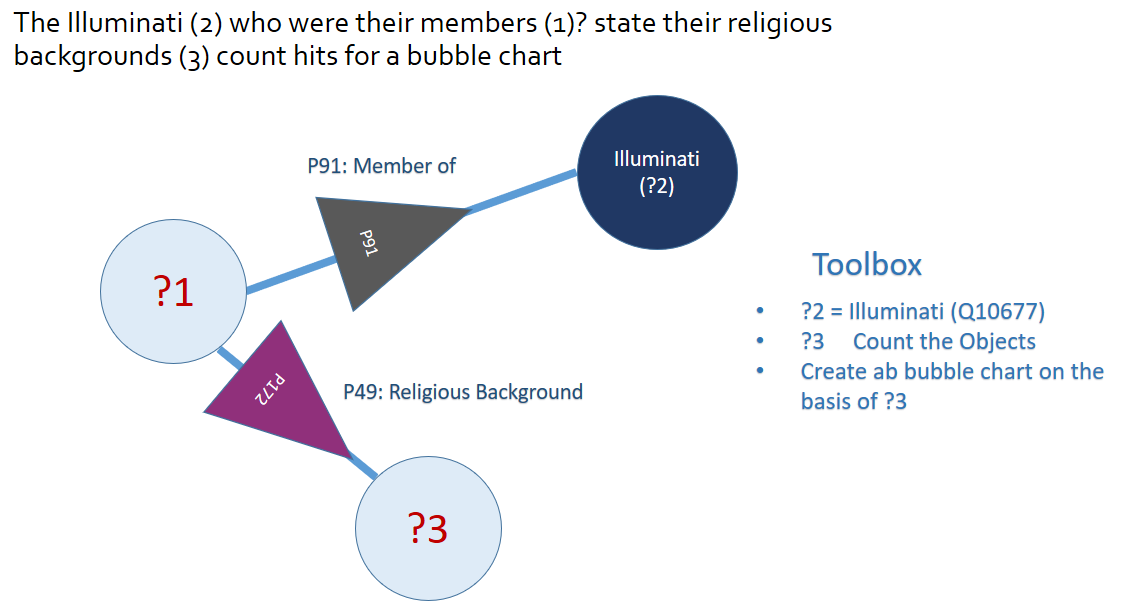
The toolbox had been open in these various searches. I used it so far to state where a specific Item had a specific value attached to it. We would use this toolbox for all the more complex visualisations. Imagine you want to get the religious backgrounds of all known Illuminati in a bubble chart. Ask for the Items that have a P91 membership statement connected to the Illuminati, Q10677. Then ask for their religious backgrounds. If you want a bubble chart you need a count of hits on each religion and denomination:
The toolbox should also be the place to create time frames. You could here specify ranges on data you have requested.
Just a thought…
A Postscript on how to use the right and left mouse buttons in the query builder
Visual scripting might be actually quite easy. With the left mouse button you create your first circle. It will come with a question mark in it.
Click into this circle with the left mouse button, and you can put a value into this circle, a label; it will replace the question mark.
Use your right hand mouse button to get a visual context menu from his point. It will come in the form of grey options to select. Two arrows are leading away from your Item, two are leading towards it. Each time you get an open offer with question marks to replace (or to leave there) and two specific arrows that will give you ideas of what is happening here:
With the left mouse button you can select the direction into which you want to move, the selected arrow and circle will switch to colour, the other three arrows will disappear. You are now free to continue with a click into the next Item or Property of your interest. Just as in the current Query Helper, you will always get a preview of 20 table rows, that will give you an idea of the results you are about to get on your search.
Seen only later…
- Pengkai Liua/ Xin Wanga/ Qiang Fua/ Yajun Yang/ Yuan-FangLi/ Qingpeng Zhang, KGVQL: A knowledge graph visual query language with bidirectional transformations. Knowledge-Based Systems
Volume 250, 17 August 2022, 108870. https://www.sciencedirect.com/science/article/pii/S0950705122004154?dgcid=rss_sd_all / https://doi.org/10.1016/j.knosys.2022.108870

