update: 25-05-2024
FactGrid is a wonderful, free and collaborative resource that the Gotha Research Center of the University of Erfurt in Germany has made available to the international historical community through the efforts of Olaf Simons. Many potential users are unfortunately put off by its apparent complexity. It is true that an initiation is necessary to exploit all its possibilities. In the future, new tools should make it much easier to use. In the meantime, it is possible to use a certain number of tools that already exist on the platform. Here I will introduce the FactGrid Viewer tool.
A first use of FactGrid is simply to search and browse the database. This is accessible to everyone, without the need to log in. However, the user interface (technically that of Wikidata, the platform for which Wikibase was produced) is not very engaging. In fact, it looks more like an input mask than a user interface. This is why I developed the Viewer, which allows you to browse FactGrid easily and comfortably. This post is a presentation of the tool and a user guide.
Presentation of the Viewer
The Viewer is a small Javascript application (it is written in Typescript with the help of the Angular framework, then transcompiled in Javascript) of about 1MB. This means that it runs on the user’s computer. The Viewer allows users to navigate within FactGrid by displaying data as structured pages in the language of their choice. To open the application, use this blog’s menu above (where it says FactGrid Browsers), use the left-hand sidebar under the Browse category of the wikibase platform or go directly to the address https://database.factgrid.de/viewer.
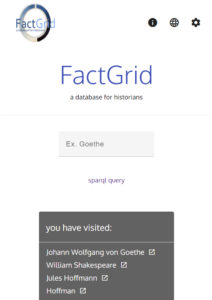
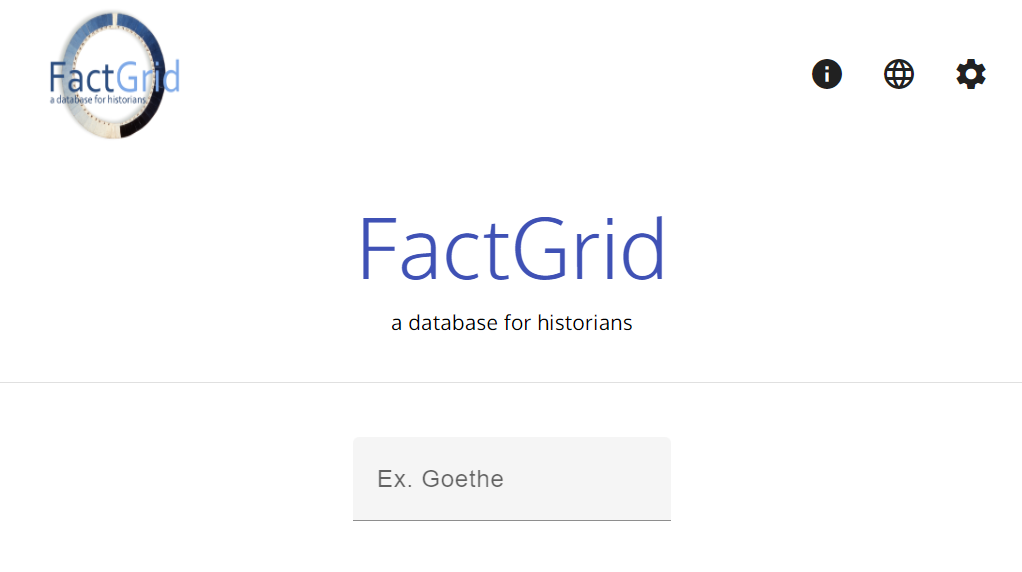
The Viewer home page is very simple. From top to bottom: (1) a banner with the logo of FactGrid on the left, three icons ![]() ,
, ![]() and
and ![]() on the right; (3) the title FactGrid; (3) a simple search form; (4) a link “SPARQL query”; (5) on a black background, the list of Items already consulted on the computer (with the same browser) (max. 50) with, for each, an icon
on the right; (3) the title FactGrid; (3) a simple search form; (4) a link “SPARQL query”; (5) on a black background, the list of Items already consulted on the computer (with the same browser) (max. 50) with, for each, an icon ![]() .
.
You have directly access to FactGrid by clicking on its logo and to this post by clicking on ![]() .
.
You can select the language in which you wish to display the data. The default language is English. To change the language, click on ![]() and select the language of your choice. Six languages are currently available: English, German, French, Spanish, Italian, Hungarian. Once the language is selected, the change is instantly implemented in the browser and all labels, aliases and descriptions are displayed in that language; if text is missing in the selected language, the Viewer will display the text in the default language, i.e. English, or, if the English text is also missing, in French or in German.
and select the language of your choice. Six languages are currently available: English, German, French, Spanish, Italian, Hungarian. Once the language is selected, the change is instantly implemented in the browser and all labels, aliases and descriptions are displayed in that language; if text is missing in the selected language, the Viewer will display the text in the default language, i.e. English, or, if the English text is also missing, in French or in German.
It is also possible to select a research area of special interest to you. By default, the search is performed on all Items in FactGrid. To limit the search to a specific theme, click on ![]() and select the theme of your choice. This feature is still in development. You can see demontration examples for Paris and the bibliography of Harmonia Universalis.
and select the theme of your choice. This feature is still in development. You can see demontration examples for Paris and the bibliography of Harmonia Universalis.
The search is done with the form (where the Ex. Goethe indication is). As you type in characters, the Viewer almost instantaneously explores the 1 million Items in FactGrid and returns those whose labels (including their aliases) begin with the characters you typed. The number of Items returned cannot exceed 50. The labels and descriptions are displayed in the selected language. To view the data for an Item, simply click on its icon ![]() .
.
Layout of a page
The Viewer pages are the heart of the Viewer. They enable all the data relating to the Items contained in FactGrid (label, description, aliases, statements) to be displayed in the selected language.
The Viewer organises the pages to make the data more readable and consistent. The layout is adapted to the size of the screen (responsive display), so that FactGrid can be consulted comfortably on a mobile phone as well as on a large screen. See the example of the page of Johann Wofgang von Goethe.
A page on the Viewer consists of one horizontal strips and five blocks.
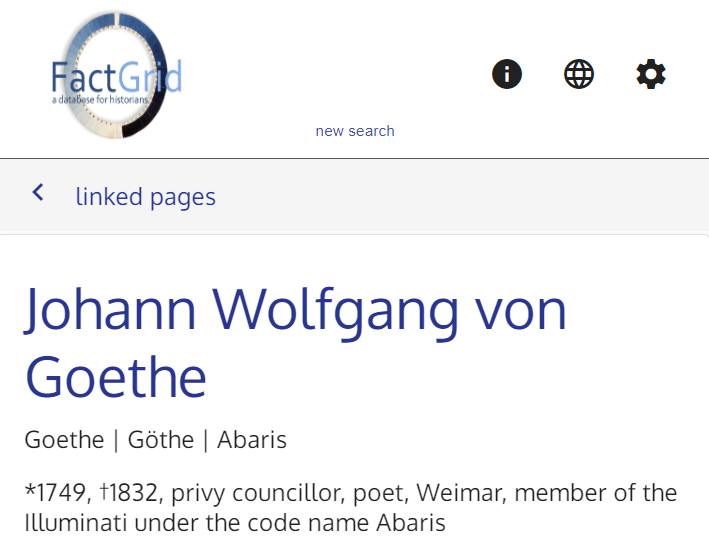
Above the strip a “new search” link takes you back to the home page. On the strip, a “linked pages” link with a chevron leads to the left-hand removable panel.
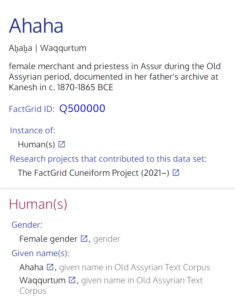
The two main blocks (see the case of Ahaha), on a white background, are :
(1) The header block. It includes the label of the Item in large type, followed by all its aliases and description, its Q-ID (clickable to go to the Item FactGrid page) and a series of general statements. The first of these statements indicates the “Instance of” for the Item (for example: Human(s)). This statement is mandatory. If it is missing, the Viewer displays a warning message. Other optional statements may follow, like “Subclasses of”, “FactGrid research area”, “Research projects that contributed to this data set”, etc. The labels are displayed without description.
(2) The statement block. This block contains all the statements related to the Item, except for the general statements in the header and the external links. A statement must consist of a property and an object (which can itself be a FactGrid Item). The statement block can be divided into thematic sub-blocks, the theme of which is indicated by a title in red (e.g. “Education”, “Career and activities”, “Sociability and culture”, etc.).
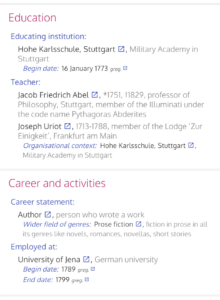
The statements in a block are grouped by property. In a group the property label is displayed in bold blue (e.g. “Educative institution”) and the object labels are displayed below in black with an indentation, each on one line, followed in general by their description in grey (except in the general thematic block where the descriptions, almost always obvious, have been considered unnecessary). An icon ![]() may be used to go to the corresponding page.
may be used to go to the corresponding page.
A statement may include additional information. Firstly, there are qualifiers (e.g. a date or a place). These are displayed with an indentation after the main information on the object in smaller characters (the name of the qualifier, i.e. the label of the corresponding property, is in blue italics, the label of the object is in black roman and the description in grey). Then there are the references (e.g. the mention of a source) with an indentation, also in small print (the name of the reference, i.e. the label of the corresponding property, is in red italics, its object is in black roman and the description in grey). The statements of the same group are automatically ordered chronologically when date qualifiers exist.
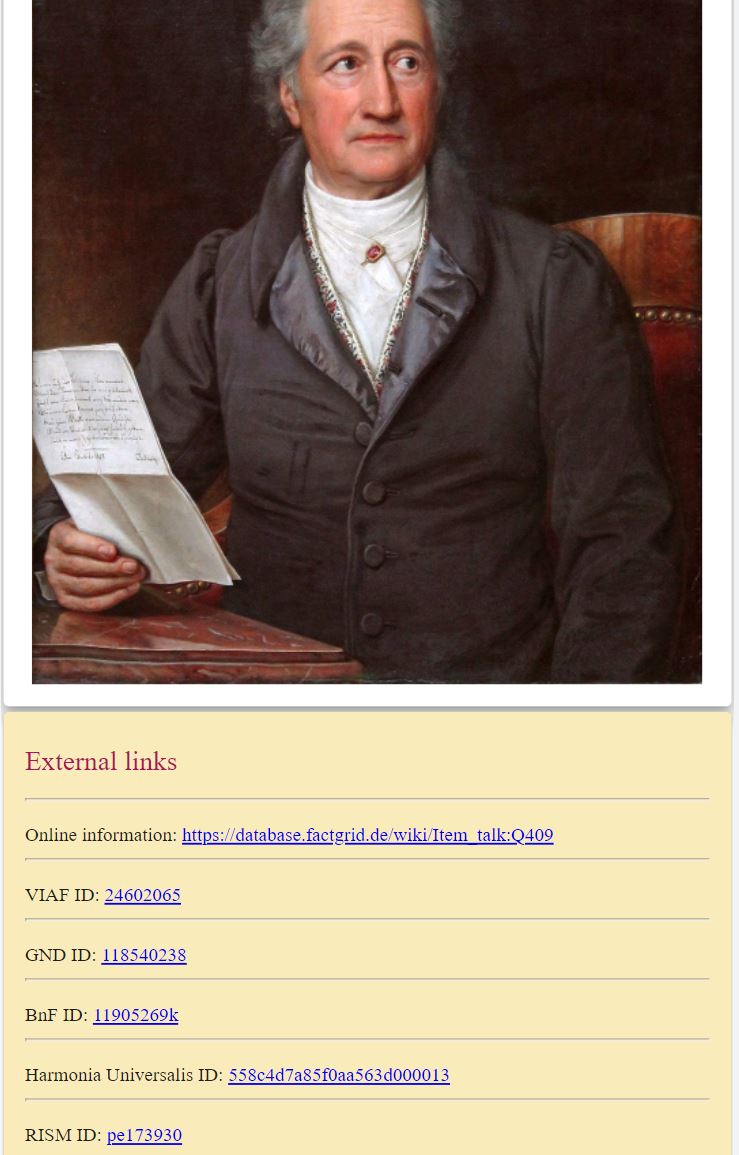
The five other blocks are :
(1) The image block where illustrations relating to the Item may be displayed. This block is at the top right on a computer screen and just below the title of the page on a mobile phone screen.
(2) The link block, with a yellow background, where external links and Wiki links (e.g. links to Wikidata or Wikipedia pages) are displayed. This block is on the right on a computer screen (below the image block when it exists) and below the main blocks on a mobile phone screen.
(3) The block of pages already consulted on the computer (with the same browser) (max. 50), on a black background, with an icon ![]() for each one (this block is also present on the home page). This block is on the right below the link block on a computer screen and below the statement block on a mobile phone screen.
for each one (this block is also present on the home page). This block is on the right below the link block on a computer screen and below the statement block on a mobile phone screen.
(4) The info block on the bottom of the statement block, accessible by clicking the icon ![]() on the blue strip, contains useful information on the Q-Item: the tree of classes to which it belongs as an instance and, in case the Q-Item is itself a class, the tree of its superclassses and a list of its instances (limit = 200).
on the blue strip, contains useful information on the Q-Item: the tree of classes to which it belongs as an instance and, in case the Q-Item is itself a class, the tree of its superclassses and a list of its instances (limit = 200).
(5) The block on the left-hand side panel, accessible by clicking on “linked pages”, contains a list of all the pages which are linked to the displayed Item, i.e. for which there is a statement (main statement or qualifier) whose object is the displayed Item. An icon ![]() allows you to go to the Item page. By clicking on “main page”, you come back to the item page.
allows you to go to the Item page. By clicking on “main page”, you come back to the item page.
Other features
In addition, the Viewer gives access to many additional pieces of information obtained by SPARQL queries, for instance:
– in the page of a family name, the list of the people in FactGrid bearing this name; ex: Müller.
– in the page of an institution (for instance a learned society), the list of the people in FactGrid who are members of this institution; ex: the mesmerist Society of Harmony in Paris.
– in the page of an address, the list of the people in FactGrid living at this address; ex: Square d’Orléans, no. 9 in Paris, where the composer Frédéric Chopin lived from 1842 to 1849.
– in the page of an occupation, the list of the people in FacGrid having this occupation: see, for instance, the cas of landscape painter.
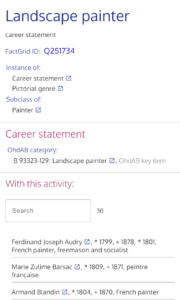
and many others…
When there are more than 15 items in the list, a search form can be used to filter items by label and description. The filtered items can be downloaded by clicking on the icon ![]() .
.
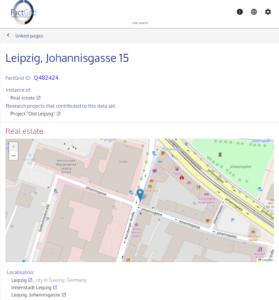
the Viewer displays on OpenStreetMap the location corresponding to the geographical coordinates declared for an Item (for example a city like Paris or an address, like the real estate at Johannisgasse 15 .
The Viewer also displays the locations corresponding to the geographical coordinates declared for a set of Items obtained by a SPARQL query.
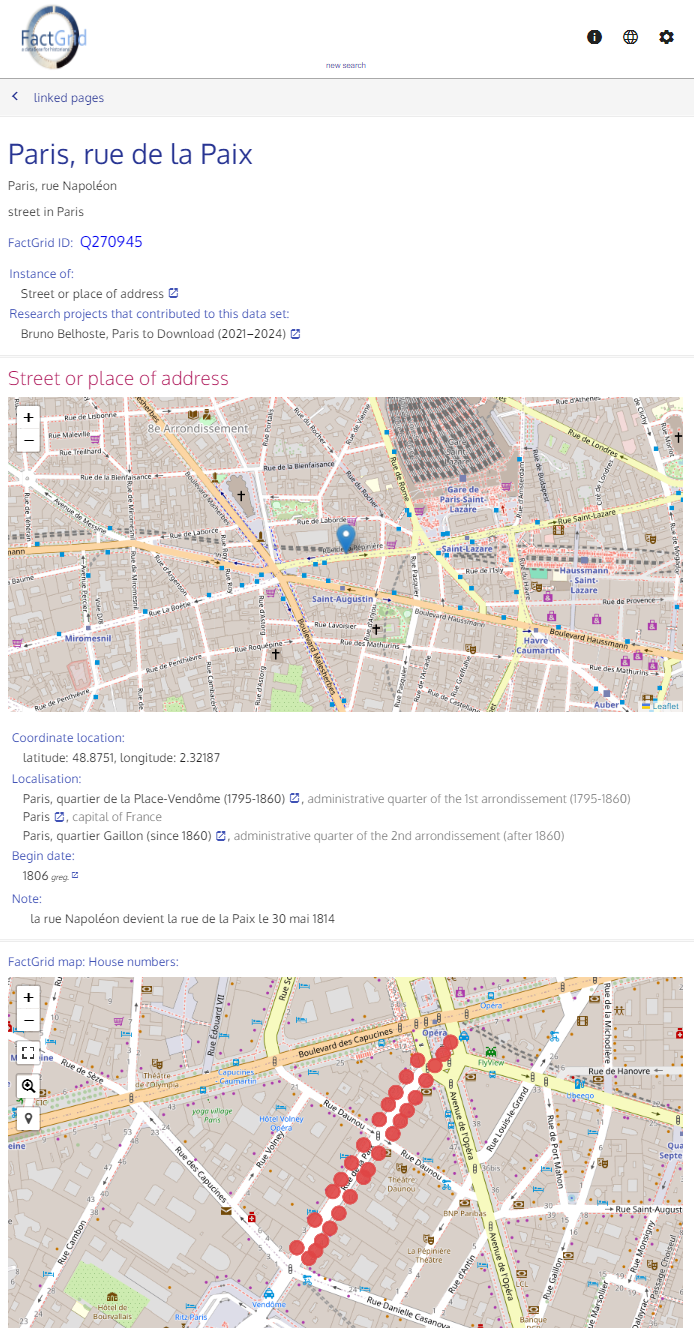
For example, on the page of the Rue de la Paix in Paris, there are two maps: a map with the location of the street and a map with all the house numbers of this street in early Nineteenth century. The second map is the product of a SPARQL query.
The FactGrid viewer also includes a SPARQL query service in the Viewer with a model. It must be used in the same way as the FactGrid query service, keeping the two bottom lines (introduced by BIND) in order to generate for each returned item a ?viewer link to the Viewer.
The Viewer can be improved. Feel free to comment. Any suggestions are welcome at bbelhoste@gmail.com.
See the GitHub repository.
